
Industrial IoT UX/UI Design for Connected Manufacturing
UX/UI Design for Industrial IoT & Manufacturing Software
We design intuitive Industrial IoT platforms, machine monitoring dashboards and manufacturing software interfaces that turn complex operational data into clear, actionable insights.
Industrial IoT UX/UI Design Services
- Industrial IoT Monitoring Dashboards
- Machine Monitoring Interfaces
- Factory Control Panels
- Real-Time Analytics Systems
- Predictive Maintenance Dashboards
- Production Monitoring Interfaces
- Industrial Data Visualization
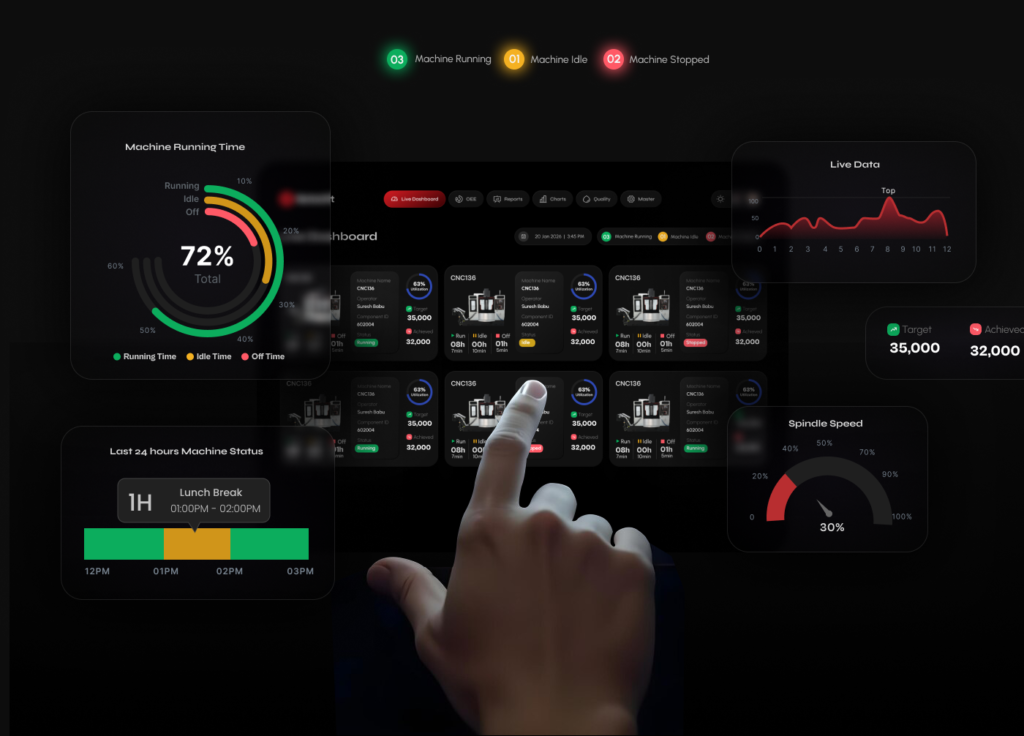
Designed for Real-World Industrial Challenges
Machine Downtime
Help teams identify machine idle time, downtime and operational issues quickly.
Complex Production Data
Transform large amounts of production and machine data into understandable visualizations.
Multiple User Roles
Design different experiences for operators, supervisors, production managers and maintenance teams.
Real-Time Monitoring
Present machine status, performance metrics and alerts in a way users can understand immediately.
Our Approach
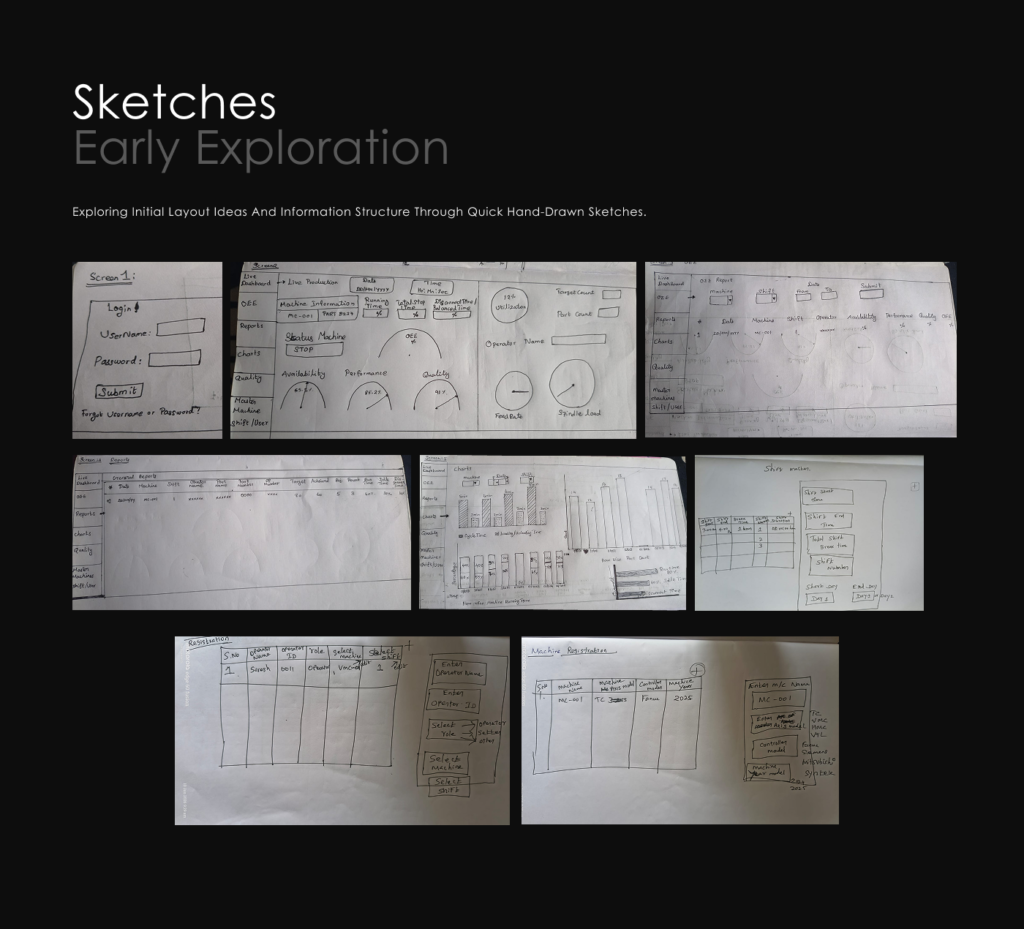
Industrial environments involve complex workflows, multiple user roles and large amounts of real-time data. We design interfaces that help teams monitor operations, understand performance and respond to issues quickly.
Our expertise includes:
- Real-Time Dashboard UX
- Industrial Data Visualization
- Machine Monitoring Interfaces
- Monitoring & Alert Systems
- OEE & Performance Dashboards
- Cross-Device Compatibility
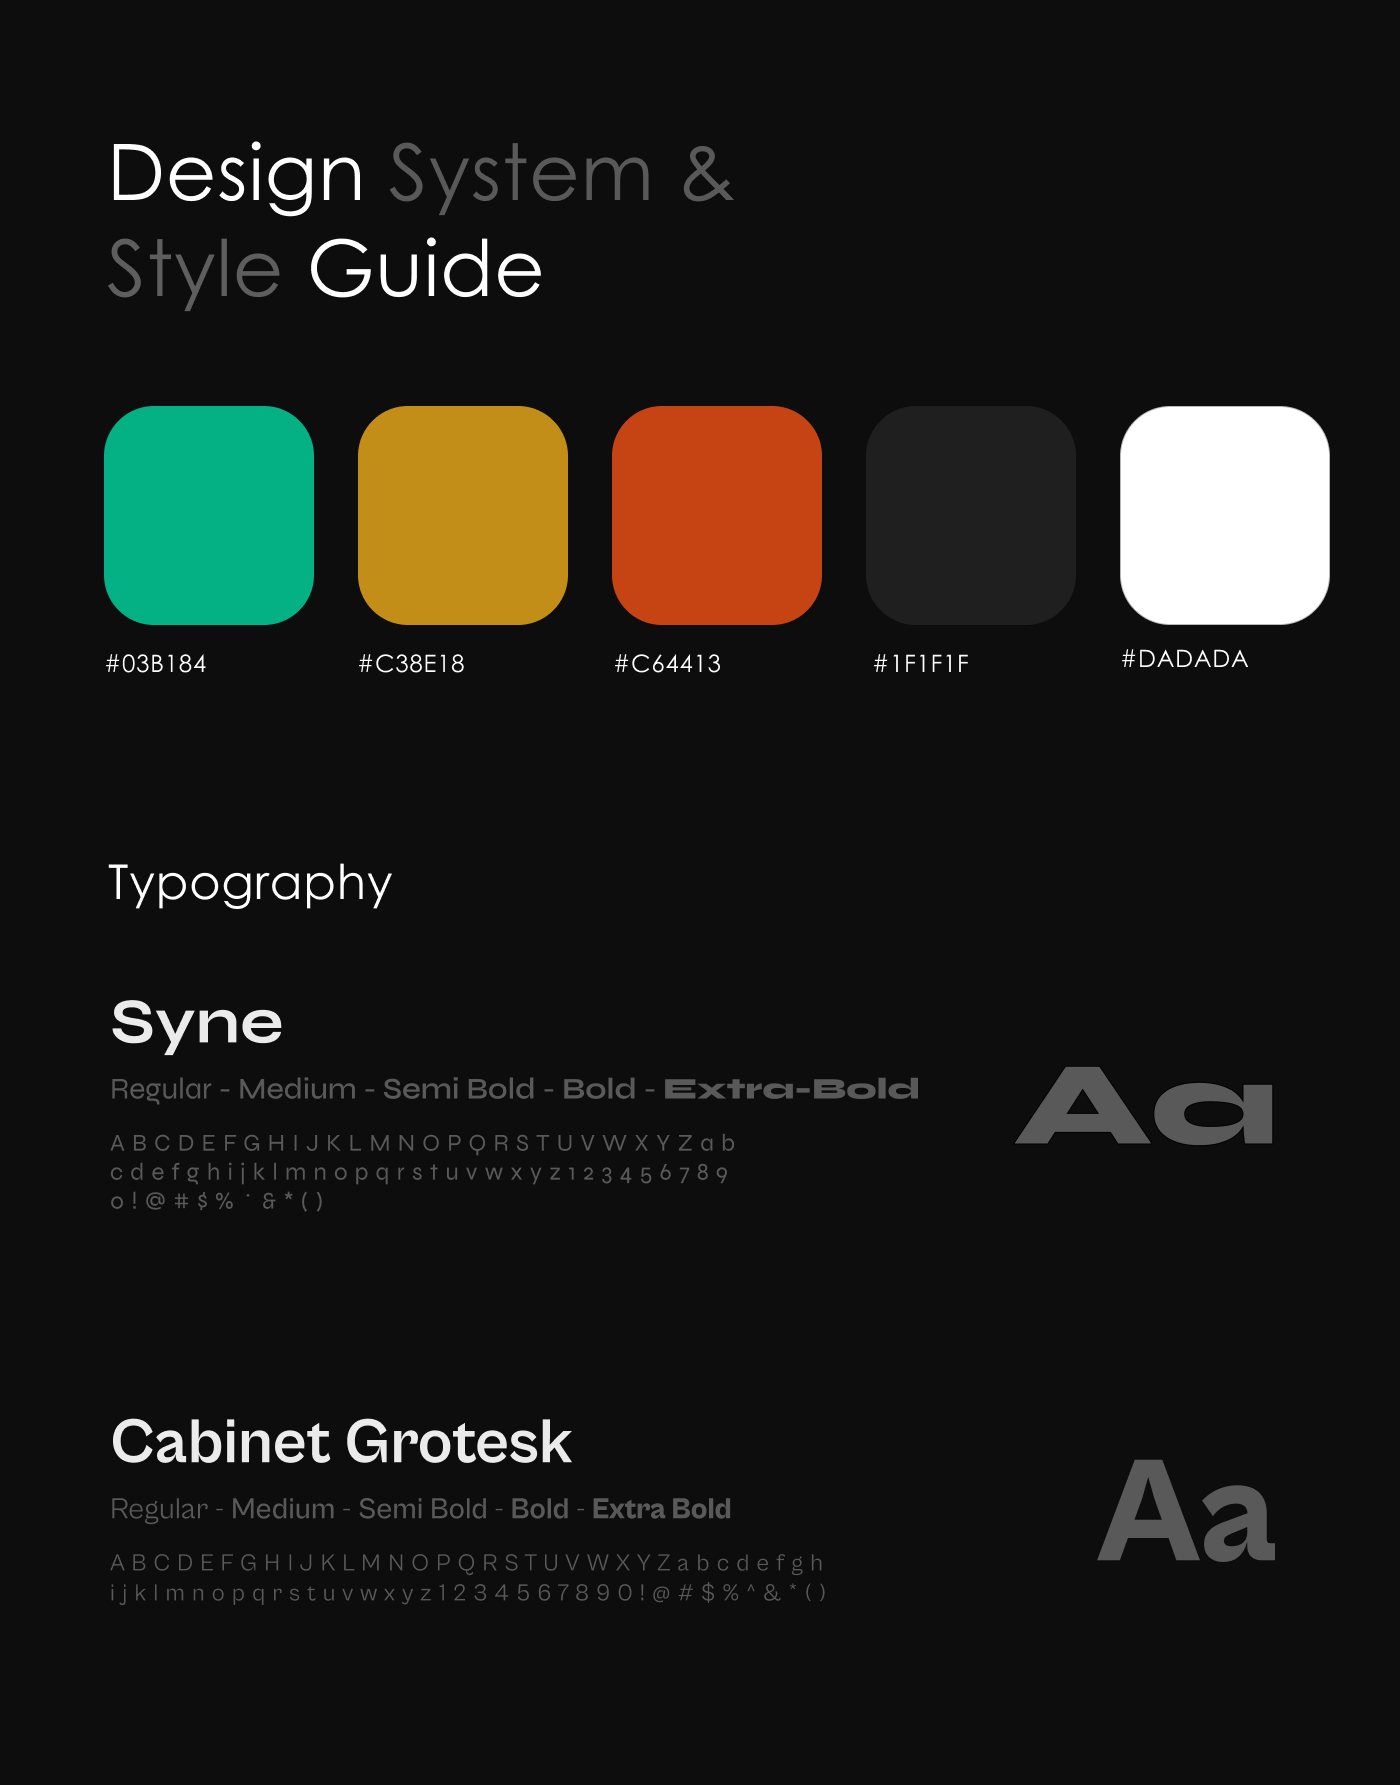
- Dark UI Dashboard Systems
- Enterprise Workflow Optimization
Who We Help Build Industrial Products For
Manufacturing Companies
Digital interfaces for production monitoring, machine performance and operational visibility.
Industrial Automation Companies
User interfaces for connected machines, control systems and industrial applications.
IoT Companies
Monitoring platforms and dashboards for connected devices and industrial systems.
SaaS & Software Companies
Industrial SaaS products and data-driven enterprise applications.
Factory Operations Teams
Interfaces that help managers, supervisors and operators understand operational performance.
Industrial Data We Help Visualize
Machine Status
Running, idle, stopped, maintenance and other operating states.
OEE
Availability, performance and quality metrics.
Production
Production count, targets, output and production trends.
Downtime
Downtime duration, reasons and machine-level analysis.
Energy
Power consumption and energy-related operational metrics.
Alerts
Real-time notifications for machine and production events.
Industrial IoT Case Study
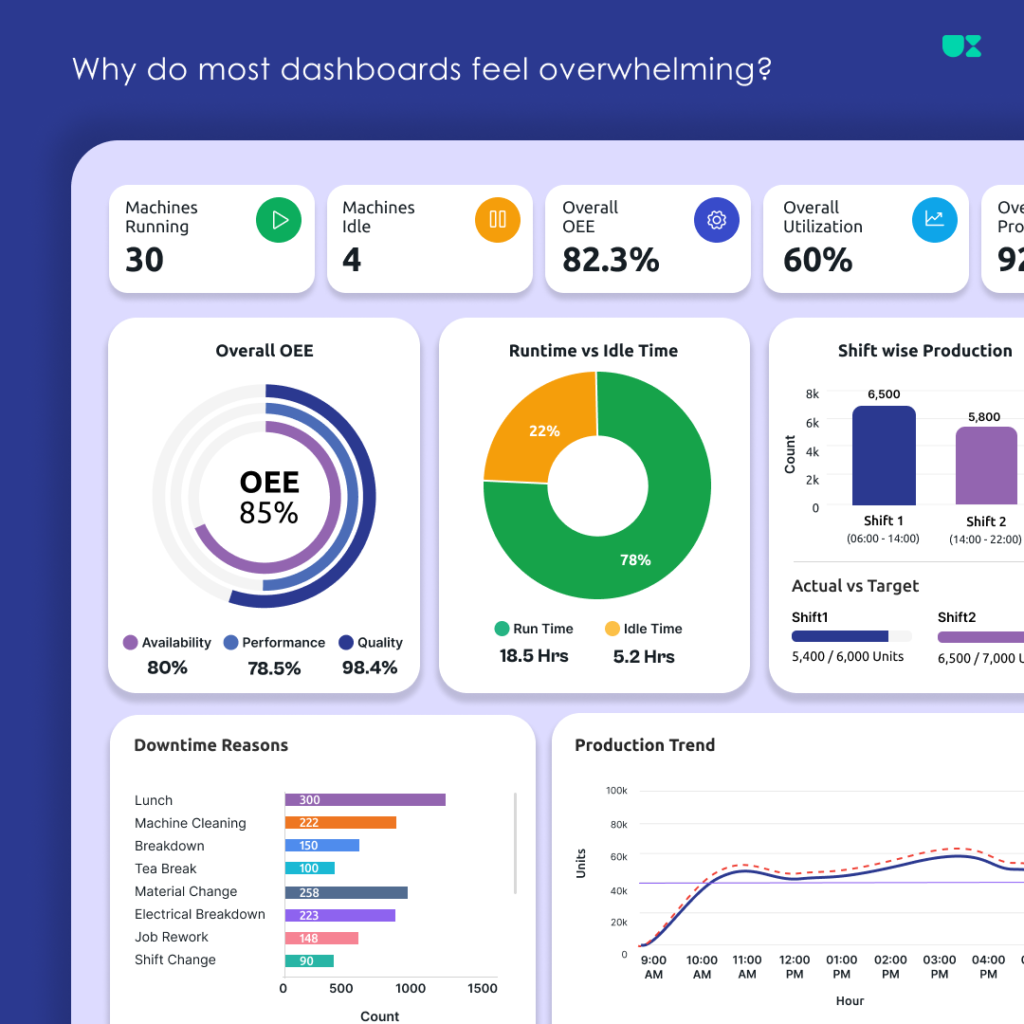
A real-time monitoring platform designed to help manufacturing teams understand machine status, utilization, OEE, production performance, downtime, alerts and real-time operational data.
We design interfaces for:
- Machine status & utilization
- OEE monitoring
- Production performance
- Downtime tracking
- Energy consumption
- Real-time alerts
- Machine comparison
- Reports & analytics
Industrial IoT UX/UI Partner for Global Companies
UXinity works with technology, manufacturing and industrial companies worldwide to design intuitive software experiences for connected operations. We can work alongside your engineering team or support your product from UX strategy through UI design and developer handoff.
- Remote collaboration
- Figma-based design workflow
- Industrial UX expertise
- Dashboard & data visualization
- Flexible engagement
- Developer-ready designs
 FAQ’S
FAQ’S Frequently Asked Questions About Industrial IoT UX/UI Design
Industrial IoT UX/UI design focuses on creating usable software interfaces for connected machines, industrial systems, monitoring platforms and operational data.
Yes. UXinity designs machine monitoring dashboards that can display machine status, utilization, OEE, production performance, downtime, alerts and other operational metrics.
Yes. We design interfaces for visualizing OEE and related availability, performance and quality metrics.
Yes. UXinity designs dashboards, monitoring applications and enterprise software experiences for manufacturing and industrial environments.
Yes. UXinity works remotely with technology, manufacturing and industrial companies worldwide.
Yes. We can collaborate with your existing engineering team and provide Figma designs, components, prototypes and developer-ready specifications.
View the full case study: Industrial-monitoring-dashboard-ui-ux-case-study
Take your business to the next level
Get a free 30-minute strategy session with our team.